Powerful features
Let PowerDash lift your energy operations and finance to new heights
Simplified provisioning
Monitoring installation and setup has traditionally been a time-consuming process requiring a range of skills and equipment. Through our manufacturer integrations and remote management capabilities, PowerDash greatly simplifies installation. With our manufacturer integrations, there isn’t any extra step required on-site to enable PowerDash. Even if PowerDash-compatible monitoring equipment does need to be installed, configuration and provisioning never requires the installer to fiddle with a laptop. With our always-on connection and smart software, configuration can be done on your mobile phone or remotely by back-office or PowerDash staff.
Hassle-free cellular connectivity
Traditionally, one of the most brittle components in monitoring, during both installation and operations, is a local network connection. It’s a hassle for the installer as well as the system owner or PPA host. From the beginning, the PowerDash approach has been based on cellular connectivity for both commercial and residential installations. Some of our manufacturer integrations include bundled cellular connectivity. In other cases, PowerDash bundles cellular connectivity at very low rates. The result is lower support costs for you and a better experience for your customers.
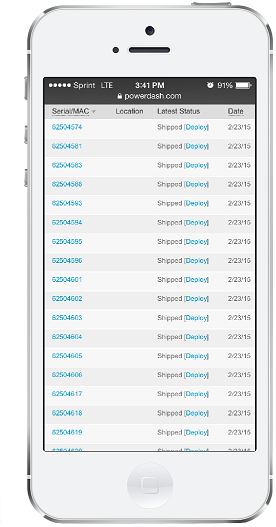
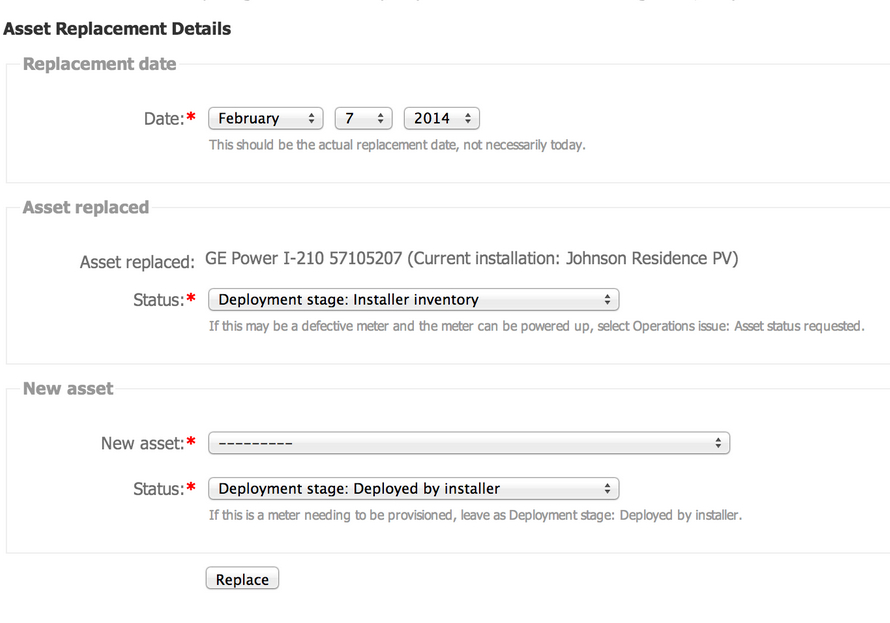
Comprehensive asset management
In PowerDash, every device, from the smallest wireless adapter to the biggest solar PV inverter, is tracked throughout its lifecycle with precise information about its network configuration, system installation status, and more. When it comes to servicing equipment, that means operations teams have critical information at their fingertips when the stakes are high and a resolution is needed.
Flexible energy benchmarking
In the new world of distributed energy, performance and ROI hinge on meeting and exceeding benchmarks. For solar PV, PowerDash will automatically create a standard PVWatts model through its innovative integration with NREL Web Services. Or if you prefer, you can also create a custom PV performance model based on your exact site plan and/or performance guarantees. Other benchmarks include environmental information such as irradiance as well as other types of energy benchmarks. These benchmarks are essential ingredients in PowerDash analytics.
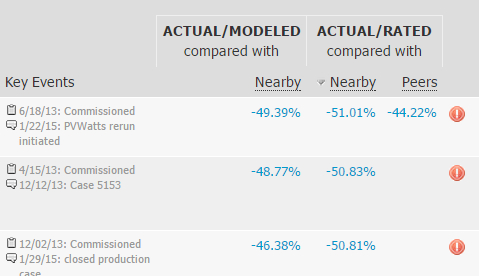
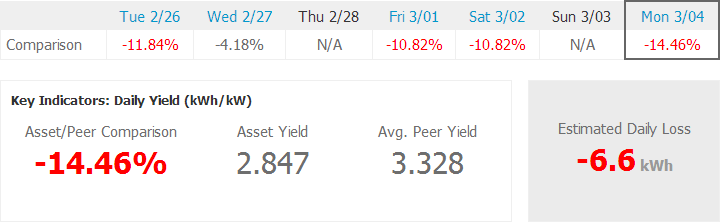
Advanced analytics
PowerDash’s advanced analytics go to the heart of energy performance, sifting through the noise to identify real system issues. Using sophisticated peer- and proximity-based comparisons, our algorithms normalize raw actual/benchmark yields to automate discovery of underperforming assets. Trusted by residential solar fleets and sophisticated multi-inverter commercial installations, these analytics help busy operations teams prioritize and resolve critical field support needs.
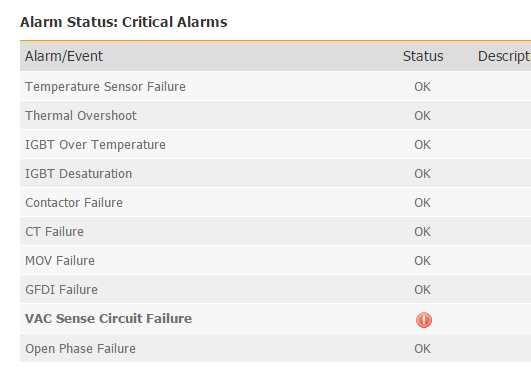
Flexible alert notifications
PowerDash analytics and issue detection drive different types of notifications in PowerDash. A daily fleet issues summary is a standard notification option for most operations staff members. More time-sensitive notifications, such as for inverter faults and other sudden energy performance failures, can be tailored to specific groups of recipients.
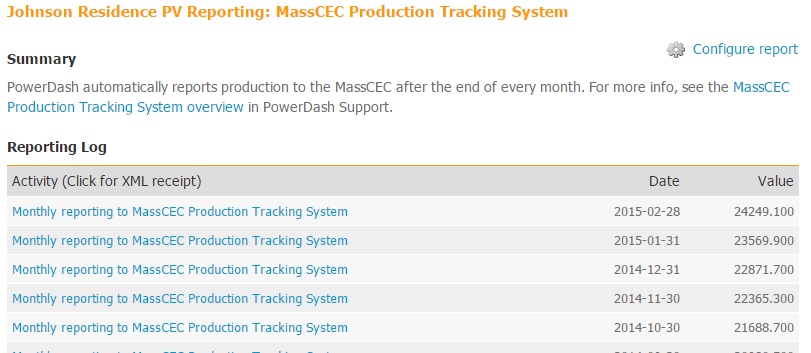
Streamlined incentive reporting
The PowerDash toolset is built with the recognition that energy asset management should fundamentally safeguard the financial health of a smart energy investment. That’s why we offer an industry-leading toolset for simplified, auditable agency reporting for RECs, SRECs, and related incentives. Through PowerDash, you can remove a hurdle for your customers by offering streamlined fulfillment of third-party REC/SREC/PDP reporting requirements.
Open integration
Although PowerDash is a comprehensive solution, we are committed to open integration on all fronts. With our support for SunSpec-compliant hardware and other interoperability approaches, we make sure device solutions are future-proof even if a customer decides to switch to a different monitoring provider. We invite the discipline of true competition. We believe that’s one of the reasons why leading energy manufacturers trust PowerDash, integrating PowerDash directly into their products. Our Web APIs, based on developer-friendly standards such as REST and JSON, further enable customers to integrate PowerDash at any level of their own software solutions. From the ground up, PowerDash has been built for integration from the device to the dashboard.